Latest Version
4.4.1
December 19, 2024
Zoho Corporation
Business
Android
11
Free
com.zoho.reports
Report a Problem
More About Zoho Analytics – Mobile BI
This mobile business intelligence (BI) application acts as an extension of Zoho Analytics, the comprehensive self-service BI and analytics platform hosted in the cloud. Designed for users on the go, this app allows individuals to monitor crucial business metrics, recognize trends early, collaborate effectively with team members, and make informed decisions while not at their desks. It brings the power of BI analytics to mobile devices, enabling users to engage with their analytics anytime, anywhere.
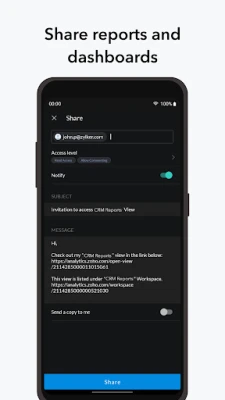
Within the app, users can access all the reports, dashboards, and data they have created or gathered in their Zoho Analytics accounts. It offers interactive capabilities, allowing users to favorite frequently accessed reports, share them with colleagues, clients, and friends while maintaining detailed access controls. This ensures that users can manage who sees what information and what actions they can perform on shared reports.
The app is engineered to facilitate comprehensive data analysis and business data analytics from a variety of sources. Its robust architecture supports the processing of significant volumes of data—up to hundreds of millions of rows—enabling the generation of detailed analytics dashboards. This scalability is crucial for businesses needing to make sense of extensive data sets efficiently.
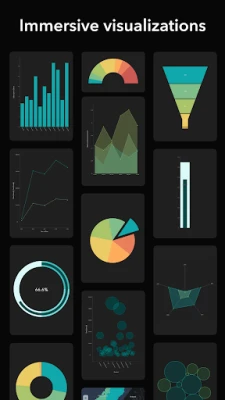
Zoho Analytics mobile app boasts an array of essential features that make it a crucial tool for business users. There are numerous visualization options available, including geo-maps, pie charts, donut charts, bar graphs, and pivot tables, among others. This variety ensures users can choose the best format to represent their data, enhancing the clarity and impact of their presentations.
Other notable features include the ability to create comprehensive dashboards tailored for various needs, such as KPIs, business performance, marketing, and sales analytics. Users can apply filters to tailor their views, drill down into specific data points for deeper insights, and arrange reports based on type and relevance. Additionally, quick access to preferred reports through a Favorites section and the seamless ability to export and share insights reinforces the app's utility in effectively managing and distributing business information.
This mobile business intelligence (BI) app complements the full web browser view offered by Zoho Analytics, the self-service BI and analytics software on the cloud. The app enables you to keep track of your key business metrics, spot trends early, collaborate with your colleagues, and arrive at informed business decisions, all on the go, enabling mobile BI analytics.
With this app, you can see all the data, reports and dashboards that you created and have in your Zoho Analytics account. You can interact with the reports, favorite those that you like or view very often, share them with your colleagues, clients and friends with fine-grained access control, and do much more.
The app allows you to analyze data and perform business data analytics, from a wide range of sources easily. It scales well and can crunch hundreds of millions of rows of data, creating analytics dashboards.
The below features make the Zoho Analytics app an indispensable mobile BI analytics and reporting tool, for any business user.
Key Features
- Wide range of visualization options - geo-map, pie, donut, bar, stacked bar, line, bar-line combo, funnel, heat-map, web and a lot more chart types; Pivot tables, summary and tabular views.
- View single page, at-a-glance dashboards.
- Dashboards like KPI dashboards, business dashboards, marketing analytics dashboards, sales analytics dashboards and much more can be created with ease
- Apply filters and see filtered data.
- See the underlying data, or drill-down any point in the report.
- Segregate reports based on type, folders and related views.
- Quickly access select reports using Favorites and Recent Items.
- Export and share your reports with your colleagues and clients, with fine-grained access control. You control what the shared user can or can't do, like create reports, view/drill-down the underlying data, export the data/reports, etc
Rate the App
User Reviews
Popular Apps


