

Latest Version
1.10
April 26, 2025
Loyverse
Business
Android
0
Free
com.loyverse.dashboard
Report a Problem
More About Loyverse Dashboard for POS
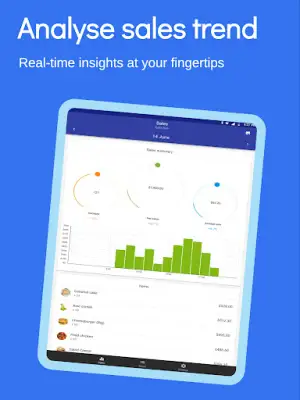
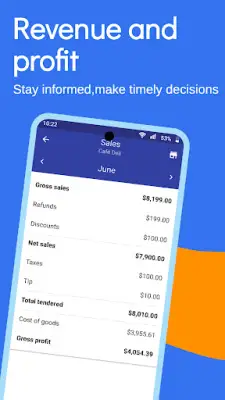
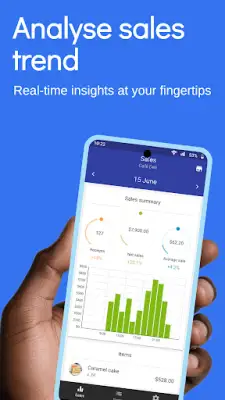
The application provides a comprehensive sales summary that allows users to view key financial metrics such as total revenue, average sales per transaction, and overall profit. This feature helps businesses understand their financial performance and make informed decisions based on real-time data. It consolidates important sales data into an easy-to-understand overview, supporting strategic planning and financial analysis.
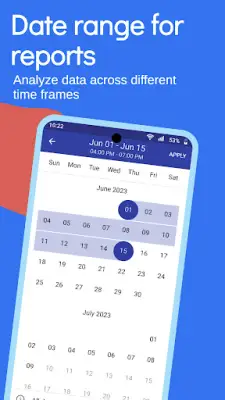
With the sales trend feature, users can monitor how sales are evolving over different periods, including daily, weekly, monthly, or yearly comparisons. This visualization helps identify growth patterns, seasonal fluctuations, or declines, enabling businesses to adapt their strategies accordingly. Tracking trends over time is essential for forecasting and setting realistic sales targets.
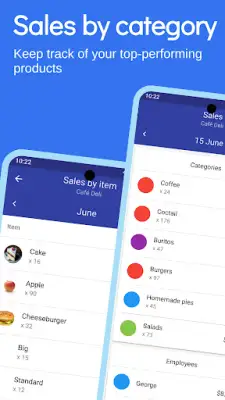
Analytics by item allows users to evaluate the performance of individual products. It helps determine which items are popular, performing averagely, or underperforming in sales. This information can guide inventory decisions, promotional efforts, and product development to focus on high-performing items and improve or phase out less successful ones.
Additional features include insights into sales by category, providing a breakdown of the best-selling product groups. The sales by employee section enables tracking of individual staff member contributions to total sales. The application also offers item stock management, where users can view current stock levels, apply filters, and quickly identify items that are low or out of stock. Real-time stock push notifications ensure that businesses are promptly informed about stock shortages, helping maintain optimal inventory levels and reduce missed sales opportunities.
Rate the App
User Reviews


Popular Apps